Observação
Clique aqui
para baixar o código de exemplo completo
plot(x, y)
Veja plot.
import matplotlib.pyplot as plt
import numpy as np
plt.style.use('_mpl-gallery')
# make data
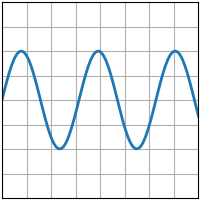
x = np.linspace(0, 10, 100)
y = 4 + 2 * np.sin(2 * x)
# plot
fig, ax = plt.subplots()
ax.plot(x, y, linewidth=2.0)
ax.set(xlim=(0, 8), xticks=np.arange(1, 8),
ylim=(0, 8), yticks=np.arange(1, 8))
plt.show()
Galeria gerada por Sphinx-Gallery