Observação
Clique aqui para baixar o código de exemplo completo
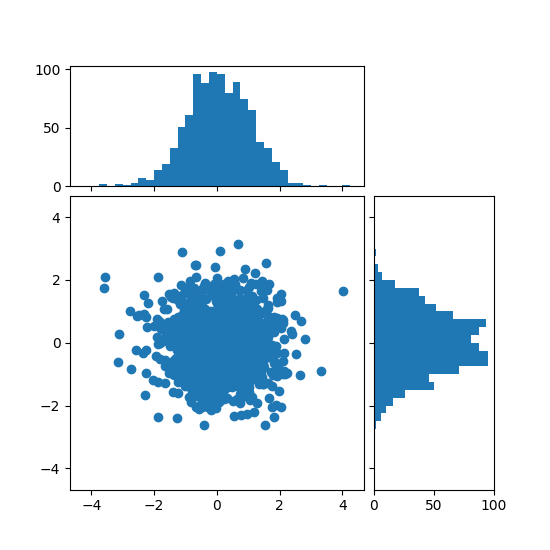
Histograma de dispersão (eixos localizáveis) #
Mostre as distribuições marginais de um gráfico de dispersão como histogramas nas laterais do gráfico.
Para um bom alinhamento dos eixos principais com os marginais, as posições dos eixos são definidas por um Divider, produzido via make_axes_locatable. Observe que a DividerAPI permite definir tamanhos de eixos e pads em polegadas, que é sua principal característica.
Se alguém quiser definir tamanhos de eixos e almofadas em relação à figura principal, consulte o gráfico de dispersão com exemplo de histogramas.
import numpy as np
import matplotlib.pyplot as plt
from mpl_toolkits.axes_grid1 import make_axes_locatable

# Fixing random state for reproducibility
np.random.seed(19680801)

# the random data
x = np.random.randn(1000)
y = np.random.randn(1000)


fig, ax = plt.subplots(figsize=(5.5, 5.5))

# the scatter plot:
ax.scatter(x, y)

# Set aspect of the main axes.
ax.set_aspect(1.)

# create new axes on the right and on the top of the current axes
divider = make_axes_locatable(ax)
# below height and pad are in inches
ax_histx = divider.append_axes("top", 1.2, pad=0.1, sharex=ax)
ax_histy = divider.append_axes("right", 1.2, pad=0.1, sharey=ax)

# make some labels invisible
ax_histx.xaxis.set_tick_params(labelbottom=False)
ax_histy.yaxis.set_tick_params(labelleft=False)

# now determine nice limits by hand:
binwidth = 0.25
xymax = max(np.max(np.abs(x)), np.max(np.abs(y)))
lim = (int(xymax/binwidth) + 1)*binwidth

bins = np.arange(-lim, lim + binwidth, binwidth)
ax_histx.hist(x, bins=bins)
ax_histy.hist(y, bins=bins, orientation='horizontal')

# the xaxis of ax_histx and yaxis of ax_histy are shared with ax,
# thus there is no need to manually adjust the xlim and ylim of these
# axis.

ax_histx.set_yticks([0, 50, 100])
ax_histy.set_xticks([0, 50, 100])

plt.show()
Referências
O uso das seguintes funções, métodos, classes e módulos é mostrado neste exemplo: