Observação
Clique aqui para baixar o código de exemplo completo
Rótulo de ângulo invariante de escala #
Este exemplo mostra como criar uma anotação de ângulo invariante de escala. Muitas vezes é útil marcar ângulos entre linhas ou dentro de formas com um arco circular. Embora o Matplotlib forneça um Arc, um problema inerente ao usá-lo diretamente para tais propósitos é que um arco sendo circular no espaço de dados não é necessariamente circular no espaço de exibição. Além disso, o raio do arco geralmente é melhor definido em um sistema de coordenadas independente das coordenadas de dados reais - pelo menos se você quiser ampliar livremente seu gráfico sem que a anotação cresça até o infinito.
Isso exige uma solução onde o centro do arco é definido no espaço de dados, mas seu raio em uma unidade física como pontos ou pixels, ou como uma proporção da dimensão dos eixos. A AngleAnnotationclasse a seguir fornece essa solução.
O exemplo abaixo serve a dois propósitos:
Ele fornece uma solução pronta para uso para o problema de desenhar facilmente ângulos em gráficos.
Ele mostra como criar uma subclasse de um artista Matplotlib para aprimorar sua funcionalidade, além de dar um exemplo prático de como usar o sistema de transformação do Matplotlib .
Se estiver interessado principalmente no primeiro, você pode copiar a classe abaixo e pular para a seção Uso .
classe AngleAnnotation #
A ideia essencial aqui é criar uma subclasse Arce definir sua transformação para IdentityTransform, tornando os parâmetros do arco definidos no espaço do pixel. Em seguida, sobrescrevemos os Arcatributos _centerde , theta1,
theta2, widthe heighte os tornamos propriedades, acoplando a métodos internos que calculam os respectivos parâmetros cada vez que o atributo é acessado e, assim, garantindo que o arco no espaço do pixel permaneça sincronizado com os pontos e tamanho de entrada. Por exemplo, toda vez que o método de desenho do arco consultar seu _center
atributo, ao invés de receber o mesmo número novamente, ele receberá o resultado do get_center_in_pixelsmétodo que definimos na subclasse. Este método transforma o centro em coordenadas de dados em pixels por meio da transformação Axesax.transData. O tamanho e os ângulos são calculados de maneira semelhante, de modo que o arco mude sua forma automaticamente ao, por exemplo, aplicar zoom ou panorâmica interativamente.
A funcionalidade desta classe permite anotar o arco com um texto. Este texto é Annotationarmazenado em um atributo text. Como a posição e o raio do arco são definidos apenas no momento do desenho, precisamos atualizar a posição do texto de acordo. Isso é feito reimplementando o Arcmétodo
draw()de para permitir que ele chame um método de atualização para o texto.
O arco e o texto serão adicionados aos eixos fornecidos na instanciação: portanto, não é estritamente necessário manter uma referência a ele.
import numpy as np
import matplotlib.pyplot as plt
from matplotlib.patches import Arc
from matplotlib.transforms import IdentityTransform, TransformedBbox, Bbox


class AngleAnnotation(Arc):
    """
    Draws an arc between two vectors which appears circular in display space.
    """
    def __init__(self, xy, p1, p2, size=75, unit="points", ax=None,
                 text="", textposition="inside", text_kw=None, **kwargs):
        """
        Parameters
        ----------
        xy, p1, p2 : tuple or array of two floats
            Center position and two points. Angle annotation is drawn between
            the two vectors connecting *p1* and *p2* with *xy*, respectively.
            Units are data coordinates.

        size : float
            Diameter of the angle annotation in units specified by *unit*.

        unit : str
            One of the following strings to specify the unit of *size*:

            * "pixels": pixels
            * "points": points, use points instead of pixels to not have a
              dependence on the DPI
            * "axes width", "axes height": relative units of Axes width, height
            * "axes min", "axes max": minimum or maximum of relative Axes
              width, height

        ax : `matplotlib.axes.Axes`
            The Axes to add the angle annotation to.

        text : str
            The text to mark the angle with.

        textposition : {"inside", "outside", "edge"}
            Whether to show the text in- or outside the arc. "edge" can be used
            for custom positions anchored at the arc's edge.

        text_kw : dict
            Dictionary of arguments passed to the Annotation.

        **kwargs
            Further parameters are passed to `matplotlib.patches.Arc`. Use this
            to specify, color, linewidth etc. of the arc.

        """
        self.ax = ax or plt.gca()
        self._xydata = xy  # in data coordinates
        self.vec1 = p1
        self.vec2 = p2
        self.size = size
        self.unit = unit
        self.textposition = textposition

        super().__init__(self._xydata, size, size, angle=0.0,
                         theta1=self.theta1, theta2=self.theta2, **kwargs)

        self.set_transform(IdentityTransform())
        self.ax.add_patch(self)

        self.kw = dict(ha="center", va="center",
                       xycoords=IdentityTransform(),
                       xytext=(0, 0), textcoords="offset points",
                       annotation_clip=True)
        self.kw.update(text_kw or {})
        self.text = ax.annotate(text, xy=self._center, **self.kw)

    def get_size(self):
        factor = 1.
        if self.unit == "points":
            factor = self.ax.figure.dpi / 72.
        elif self.unit[:4] == "axes":
            b = TransformedBbox(Bbox.unit(), self.ax.transAxes)
            dic = {"max": max(b.width, b.height),
                   "min": min(b.width, b.height),
                   "width": b.width, "height": b.height}
            factor = dic[self.unit[5:]]
        return self.size * factor

    def set_size(self, size):
        self.size = size

    def get_center_in_pixels(self):
        """return center in pixels"""
        return self.ax.transData.transform(self._xydata)

    def set_center(self, xy):
        """set center in data coordinates"""
        self._xydata = xy

    def get_theta(self, vec):
        vec_in_pixels = self.ax.transData.transform(vec) - self._center
        return np.rad2deg(np.arctan2(vec_in_pixels[1], vec_in_pixels[0]))

    def get_theta1(self):
        return self.get_theta(self.vec1)

    def get_theta2(self):
        return self.get_theta(self.vec2)

    def set_theta(self, angle):
        pass

    # Redefine attributes of the Arc to always give values in pixel space
    _center = property(get_center_in_pixels, set_center)
    theta1 = property(get_theta1, set_theta)
    theta2 = property(get_theta2, set_theta)
    width = property(get_size, set_size)
    height = property(get_size, set_size)

    # The following two methods are needed to update the text position.
    def draw(self, renderer):
        self.update_text()
        super().draw(renderer)

    def update_text(self):
        c = self._center
        s = self.get_size()
        angle_span = (self.theta2 - self.theta1) % 360
        angle = np.deg2rad(self.theta1 + angle_span / 2)
        r = s / 2
        if self.textposition == "inside":
            r = s / np.interp(angle_span, [60, 90, 135, 180],
                                          [3.3, 3.5, 3.8, 4])
        self.text.xy = c + r * np.array([np.cos(angle), np.sin(angle)])
        if self.textposition == "outside":
            def R90(a, r, w, h):
                if a < np.arctan(h/2/(r+w/2)):
                    return np.sqrt((r+w/2)**2 + (np.tan(a)*(r+w/2))**2)
                else:
                    c = np.sqrt((w/2)**2+(h/2)**2)
                    T = np.arcsin(c * np.cos(np.pi/2 - a + np.arcsin(h/2/c))/r)
                    xy = r * np.array([np.cos(a + T), np.sin(a + T)])
                    xy += np.array([w/2, h/2])
                    return np.sqrt(np.sum(xy**2))

            def R(a, r, w, h):
                aa = (a % (np.pi/4))*((a % (np.pi/2)) <= np.pi/4) + \
                     (np.pi/4 - (a % (np.pi/4)))*((a % (np.pi/2)) >= np.pi/4)
                return R90(aa, r, *[w, h][::int(np.sign(np.cos(2*a)))])

            bbox = self.text.get_window_extent()
            X = R(angle, r, bbox.width, bbox.height)
            trans = self.ax.figure.dpi_scale_trans.inverted()
            offs = trans.transform(((X-s/2), 0))[0] * 72
            self.text.set_position([offs*np.cos(angle), offs*np.sin(angle)])
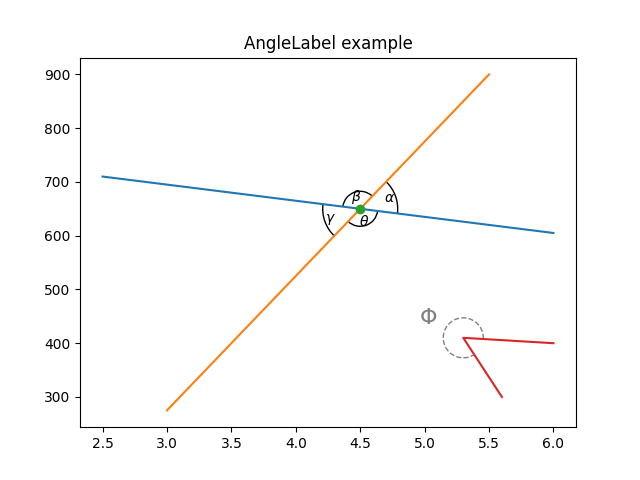
Número de uso
Os argumentos necessários para AngleAnnotationsão o centro do arco, xy , e dois pontos, de modo que o arco se estenda entre os dois vetores conectando
p1 e p2 com xy , respectivamente. Esses são dados em coordenadas de dados. Outros argumentos são o tamanho do arco e sua unidade . Além disso, um
texto pode ser especificado, que será desenhado dentro ou fora do arco, de acordo com o valor de textposition . O uso desses argumentos é mostrado abaixo.
fig, ax = plt.subplots()
fig.canvas.draw()  # Need to draw the figure to define renderer
ax.set_title("AngleLabel example")

# Plot two crossing lines and label each angle between them with the above
# ``AngleAnnotation`` tool.
center = (4.5, 650)
p1 = [(2.5, 710), (6.0, 605)]
p2 = [(3.0, 275), (5.5, 900)]
line1, = ax.plot(*zip(*p1))
line2, = ax.plot(*zip(*p2))
point, = ax.plot(*center, marker="o")

am1 = AngleAnnotation(center, p1[1], p2[1], ax=ax, size=75, text=r"$\alpha$")
am2 = AngleAnnotation(center, p2[1], p1[0], ax=ax, size=35, text=r"$\beta$")
am3 = AngleAnnotation(center, p1[0], p2[0], ax=ax, size=75, text=r"$\gamma$")
am4 = AngleAnnotation(center, p2[0], p1[1], ax=ax, size=35, text=r"$\theta$")


# Showcase some styling options for the angle arc, as well as the text.
p = [(6.0, 400), (5.3, 410), (5.6, 300)]
ax.plot(*zip(*p))
am5 = AngleAnnotation(p[1], p[0], p[2], ax=ax, size=40, text=r"$\Phi$",
                      linestyle="--", color="gray", textposition="outside",
                      text_kw=dict(fontsize=16, color="gray"))
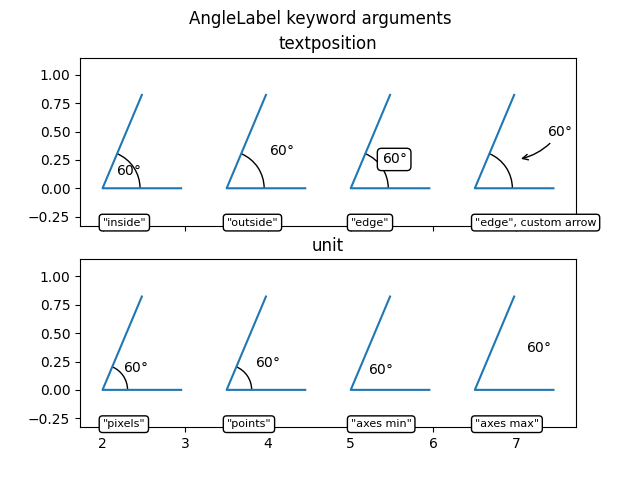
AngleLabelopções #
Os argumentos de palavra-chave textposition e unit podem ser usados para modificar a localização do rótulo de texto, conforme mostrado abaixo:
# Helper function to draw angle easily.
def plot_angle(ax, pos, angle, length=0.95, acol="C0", **kwargs):
    vec2 = np.array([np.cos(np.deg2rad(angle)), np.sin(np.deg2rad(angle))])
    xy = np.c_[[length, 0], [0, 0], vec2*length].T + np.array(pos)
    ax.plot(*xy.T, color=acol)
    return AngleAnnotation(pos, xy[0], xy[2], ax=ax, **kwargs)


fig, (ax1, ax2) = plt.subplots(nrows=2, sharex=True)
fig.suptitle("AngleLabel keyword arguments")
fig.canvas.draw()  # Need to draw the figure to define renderer

# Showcase different text positions.
ax1.margins(y=0.4)
ax1.set_title("textposition")
kw = dict(size=75, unit="points", text=r"$60°$")

am6 = plot_angle(ax1, (2.0, 0), 60, textposition="inside", **kw)
am7 = plot_angle(ax1, (3.5, 0), 60, textposition="outside", **kw)
am8 = plot_angle(ax1, (5.0, 0), 60, textposition="edge",
                 text_kw=dict(bbox=dict(boxstyle="round", fc="w")), **kw)
am9 = plot_angle(ax1, (6.5, 0), 60, textposition="edge",
                 text_kw=dict(xytext=(30, 20), arrowprops=dict(arrowstyle="->",
                              connectionstyle="arc3,rad=-0.2")), **kw)

for x, text in zip([2.0, 3.5, 5.0, 6.5], ['"inside"', '"outside"', '"edge"',
                                          '"edge", custom arrow']):
    ax1.annotate(text, xy=(x, 0), xycoords=ax1.get_xaxis_transform(),
                 bbox=dict(boxstyle="round", fc="w"), ha="left", fontsize=8,
                 annotation_clip=True)

# Showcase different size units. The effect of this can best be observed
# by interactively changing the figure size
ax2.margins(y=0.4)
ax2.set_title("unit")
kw = dict(text=r"$60°$", textposition="outside")

am10 = plot_angle(ax2, (2.0, 0), 60, size=50, unit="pixels", **kw)
am11 = plot_angle(ax2, (3.5, 0), 60, size=50, unit="points", **kw)
am12 = plot_angle(ax2, (5.0, 0), 60, size=0.25, unit="axes min", **kw)
am13 = plot_angle(ax2, (6.5, 0), 60, size=0.25, unit="axes max", **kw)

for x, text in zip([2.0, 3.5, 5.0, 6.5], ['"pixels"', '"points"',
                                          '"axes min"', '"axes max"']):
    ax2.annotate(text, xy=(x, 0), xycoords=ax2.get_xaxis_transform(),
                 bbox=dict(boxstyle="round", fc="w"), ha="left", fontsize=8,
                 annotation_clip=True)

plt.show()
Referências
O uso das seguintes funções, métodos, classes e módulos é mostrado neste exemplo:
Tempo total de execução do script: ( 0 minutos 1,034 segundos)