Observação
Clique aqui para baixar o código de exemplo completo
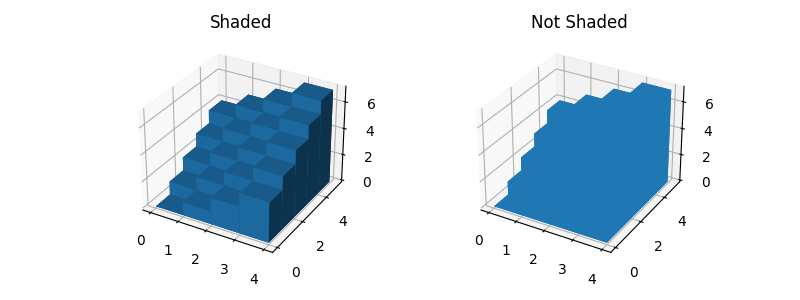
Demonstração de gráficos de barras 3D #
Uma demonstração básica de como plotar barras 3D com e sem sombreamento.
import numpy as np
import matplotlib.pyplot as plt


# setup the figure and axes
fig = plt.figure(figsize=(8, 3))
ax1 = fig.add_subplot(121, projection='3d')
ax2 = fig.add_subplot(122, projection='3d')

# fake data
_x = np.arange(4)
_y = np.arange(5)
_xx, _yy = np.meshgrid(_x, _y)
x, y = _xx.ravel(), _yy.ravel()

top = x + y
bottom = np.zeros_like(top)
width = depth = 1

ax1.bar3d(x, y, bottom, width, depth, top, shade=True)
ax1.set_title('Shaded')

ax2.bar3d(x, y, bottom, width, depth, top, shade=False)
ax2.set_title('Not Shaded')

plt.show()