Observação
Clique aqui para baixar o código de exemplo completo
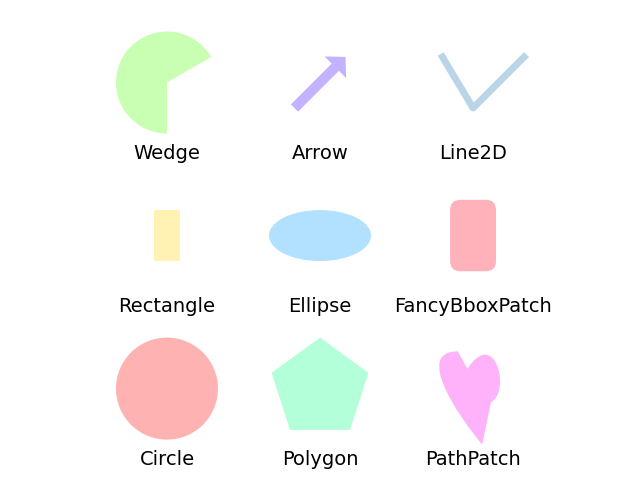
Referência para artistas Matplotlib #
Este exemplo exibe vários primitivos gráficos do Matplotlib (artistas) desenhados usando a API matplotlib. Uma lista completa de artistas e a documentação estão disponíveis na API do artista .
Copyright (c) 2010, Bartosz Telenczuk Licença BSD
import matplotlib.pyplot as plt
import numpy as np
import matplotlib.path as mpath
import matplotlib.lines as mlines
import matplotlib.patches as mpatches
from matplotlib.collections import PatchCollection


def label(xy, text):
    y = xy[1] - 0.15  # shift y-value for label so that it's below the artist
    plt.text(xy[0], y, text, ha="center", family='sans-serif', size=14)


fig, ax = plt.subplots()
# create 3x3 grid to plot the artists
grid = np.mgrid[0.2:0.8:3j, 0.2:0.8:3j].reshape(2, -1).T

patches = []

# add a circle
circle = mpatches.Circle(grid[0], 0.1, ec="none")
patches.append(circle)
label(grid[0], "Circle")

# add a rectangle
rect = mpatches.Rectangle(grid[1] - [0.025, 0.05], 0.05, 0.1, ec="none")
patches.append(rect)
label(grid[1], "Rectangle")

# add a wedge
wedge = mpatches.Wedge(grid[2], 0.1, 30, 270, ec="none")
patches.append(wedge)
label(grid[2], "Wedge")

# add a Polygon
polygon = mpatches.RegularPolygon(grid[3], 5, radius=0.1)
patches.append(polygon)
label(grid[3], "Polygon")

# add an ellipse
ellipse = mpatches.Ellipse(grid[4], 0.2, 0.1)
patches.append(ellipse)
label(grid[4], "Ellipse")

# add an arrow
arrow = mpatches.Arrow(grid[5, 0] - 0.05, grid[5, 1] - 0.05, 0.1, 0.1,
                       width=0.1)
patches.append(arrow)
label(grid[5], "Arrow")

# add a path patch
Path = mpath.Path
path_data = [
    (Path.MOVETO, [0.018, -0.11]),
    (Path.CURVE4, [-0.031, -0.051]),
    (Path.CURVE4, [-0.115, 0.073]),
    (Path.CURVE4, [-0.03, 0.073]),
    (Path.LINETO, [-0.011, 0.039]),
    (Path.CURVE4, [0.043, 0.121]),
    (Path.CURVE4, [0.075, -0.005]),
    (Path.CURVE4, [0.035, -0.027]),
    (Path.CLOSEPOLY, [0.018, -0.11])]
codes, verts = zip(*path_data)
path = mpath.Path(verts + grid[6], codes)
patch = mpatches.PathPatch(path)
patches.append(patch)
label(grid[6], "PathPatch")

# add a fancy box
fancybox = mpatches.FancyBboxPatch(
    grid[7] - [0.025, 0.05], 0.05, 0.1,
    boxstyle=mpatches.BoxStyle("Round", pad=0.02))
patches.append(fancybox)
label(grid[7], "FancyBboxPatch")

# add a line
x, y = ([-0.06, 0.0, 0.1], [0.05, -0.05, 0.05])
line = mlines.Line2D(x + grid[8, 0], y + grid[8, 1], lw=5., alpha=0.3)
label(grid[8], "Line2D")

colors = np.linspace(0, 1, len(patches))
collection = PatchCollection(patches, cmap=plt.cm.hsv, alpha=0.3)
collection.set_array(colors)
ax.add_collection(collection)
ax.add_line(line)

plt.axis('equal')
plt.axis('off')
plt.tight_layout()

plt.show()
Referências
O uso das seguintes funções, métodos, classes e módulos é mostrado neste exemplo: