Observação
Clique aqui para baixar o código de exemplo completo
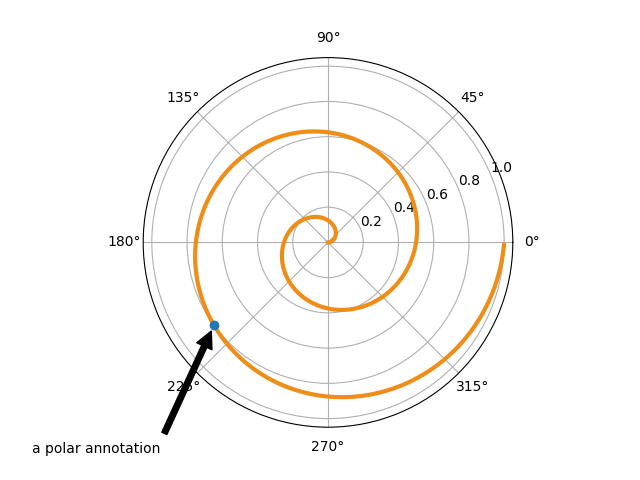
Anotação Polar #
Este exemplo mostra como criar uma anotação em um gráfico polar.
Para obter uma visão geral completa dos recursos de anotação, consulte também o tutorial de anotação .
import numpy as np
import matplotlib.pyplot as plt

fig = plt.figure()
ax = fig.add_subplot(projection='polar')
r = np.arange(0, 1, 0.001)
theta = 2 * 2*np.pi * r
line, = ax.plot(theta, r, color='#ee8d18', lw=3)

ind = 800
thisr, thistheta = r[ind], theta[ind]
ax.plot([thistheta], [thisr], 'o')
ax.annotate('a polar annotation',
            xy=(thistheta, thisr),  # theta, radius
            xytext=(0.05, 0.05),    # fraction, fraction
            textcoords='figure fraction',
            arrowprops=dict(facecolor='black', shrink=0.05),
            horizontalalignment='left',
            verticalalignment='bottom',
            )
plt.show()
Referências
O uso das seguintes funções, métodos, classes e módulos é mostrado neste exemplo: