Observação
Clique aqui para baixar o código de exemplo completo
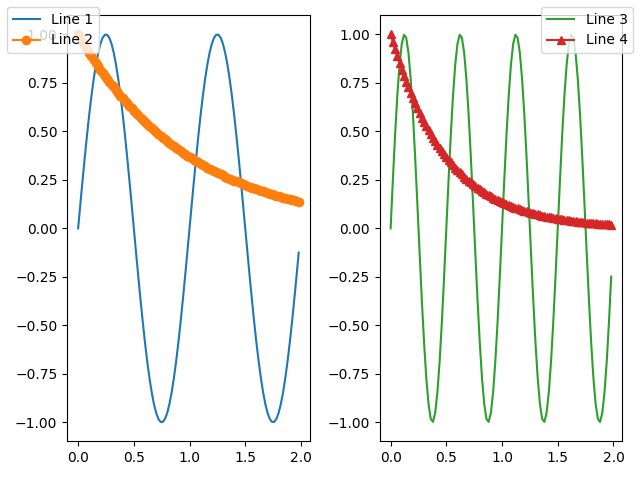
Demonstração da legenda da figura #
Em vez de plotar uma legenda em cada eixo, uma legenda para todos os artistas em todos os subeixos de uma figura pode ser plotada.
import numpy as np
import matplotlib.pyplot as plt

fig, axs = plt.subplots(1, 2)

x = np.arange(0.0, 2.0, 0.02)
y1 = np.sin(2 * np.pi * x)
y2 = np.exp(-x)
l1, = axs[0].plot(x, y1)
l2, = axs[0].plot(x, y2, marker='o')

y3 = np.sin(4 * np.pi * x)
y4 = np.exp(-2 * x)
l3, = axs[1].plot(x, y3, color='tab:green')
l4, = axs[1].plot(x, y4, color='tab:red', marker='^')

fig.legend((l1, l2), ('Line 1', 'Line 2'), loc='upper left')
fig.legend((l3, l4), ('Line 3', 'Line 4'), loc='upper right')

plt.tight_layout()
plt.show()