Observação
Clique aqui para baixar o código de exemplo completo
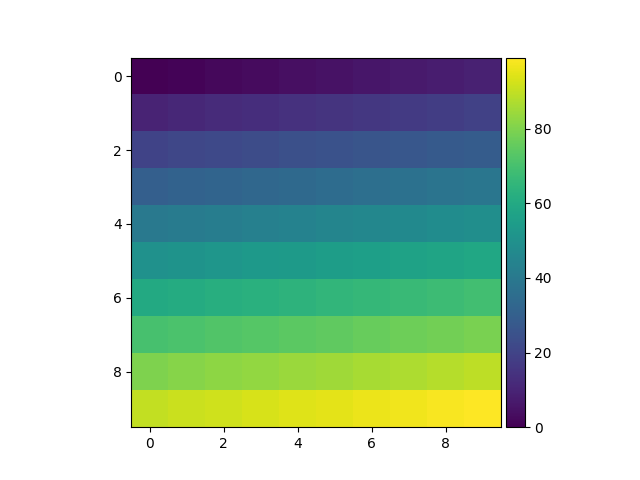
Barra de cores simples #
import matplotlib.pyplot as plt
from mpl_toolkits.axes_grid1 import make_axes_locatable
import numpy as np

ax = plt.subplot()
im = ax.imshow(np.arange(100).reshape((10, 10)))

# create an Axes on the right side of ax. The width of cax will be 5%
# of ax and the padding between cax and ax will be fixed at 0.05 inch.
divider = make_axes_locatable(ax)
cax = divider.append_axes("right", size="5%", pad=0.05)

plt.colorbar(im, cax=cax)

plt.show()