Observação
Clique aqui para baixar o código de exemplo completo
Demonstração axhspan #
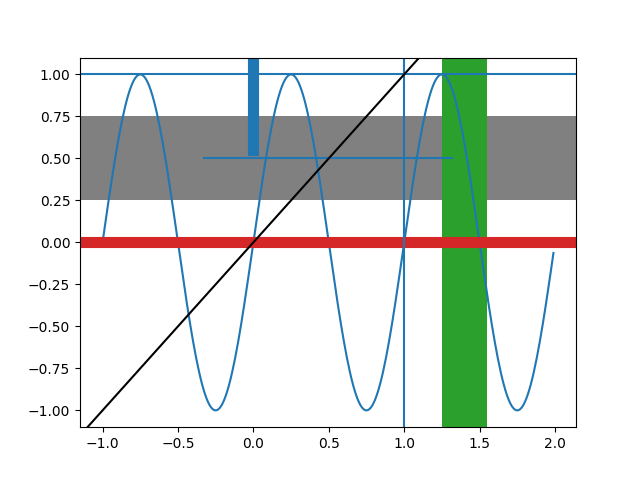
Crie linhas ou retângulos que abrangem os eixos na direção horizontal ou vertical e linhas que abrangem os eixos com uma orientação arbitrária.

import numpy as np
import matplotlib.pyplot as plt

t = np.arange(-1, 2, .01)
s = np.sin(2 * np.pi * t)

fig, ax = plt.subplots()

ax.plot(t, s)
# Thick red horizontal line at y=0 that spans the xrange.
ax.axhline(linewidth=8, color='#d62728')
# Horizontal line at y=1 that spans the xrange.
ax.axhline(y=1)
# Vertical line at x=1 that spans the yrange.
ax.axvline(x=1)
# Thick blue vertical line at x=0 that spans the upper quadrant of the yrange.
ax.axvline(x=0, ymin=0.75, linewidth=8, color='#1f77b4')
# Default hline at y=.5 that spans the middle half of the axes.
ax.axhline(y=.5, xmin=0.25, xmax=0.75)
# Infinite black line going through (0, 0) to (1, 1).
ax.axline((0, 0), (1, 1), color='k')
# 50%-gray rectangle spanning the axes' width from y=0.25 to y=0.75.
ax.axhspan(0.25, 0.75, facecolor='0.5')
# Green rectangle spanning the axes' height from x=1.25 to x=1.55.
ax.axvspan(1.25, 1.55, facecolor='#2ca02c')

plt.show()