Observação
Clique aqui para baixar o código de exemplo completo
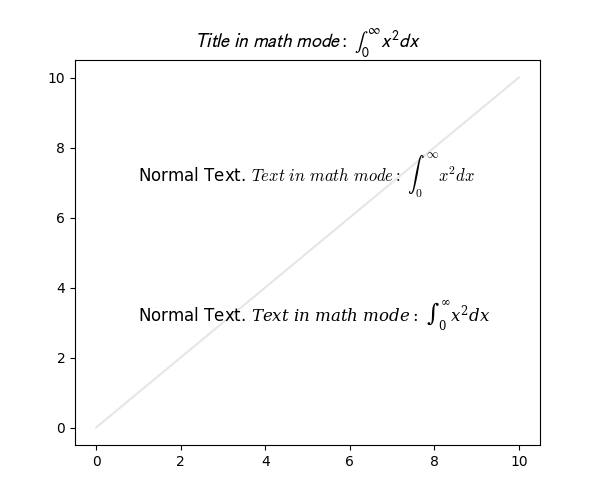
Família de fontes matemáticas #
Um exemplo simples mostrando o novo parâmetro math_fontfamily que pode ser usado para alterar a família de fontes para cada elemento de texto individual em um gráfico.
Se nenhum parâmetro for definido, o valor global
rcParams["mathtext.fontset"](padrão: 'dejavusans') será usado.
import matplotlib.pyplot as plt


fig, ax = plt.subplots(figsize=(6, 5))

# A simple plot for the background.
ax.plot(range(11), color="0.9")

# A text mixing normal text and math text.
msg = (r"Normal Text. $Text\ in\ math\ mode:\ "
       r"\int_{0}^{\infty } x^2 dx$")

# Set the text in the plot.
ax.text(1, 7, msg, size=12, math_fontfamily='cm')

# Set another font for the next text.
ax.text(1, 3, msg, size=12, math_fontfamily='dejavuserif')

# *math_fontfamily* can be used in most places where there is text,
# like in the title:
ax.set_title(r"$Title\ in\ math\ mode:\ \int_{0}^{\infty } x^2 dx$",
             math_fontfamily='stixsans', size=14)

# Note that the normal text is not changed by *math_fontfamily*.
plt.show()