Observação
Clique aqui para baixar o código de exemplo completo
Demonstração do Boxplot #
Exemplo de código boxplot
import numpy as np
import matplotlib.pyplot as plt

# Fixing random state for reproducibility
np.random.seed(19680801)

# fake up some data
spread = np.random.rand(50) * 100
center = np.ones(25) * 50
flier_high = np.random.rand(10) * 100 + 100
flier_low = np.random.rand(10) * -100
data = np.concatenate((spread, center, flier_high, flier_low))
fig1, ax1 = plt.subplots()
ax1.set_title('Basic Plot')
ax1.boxplot(data)
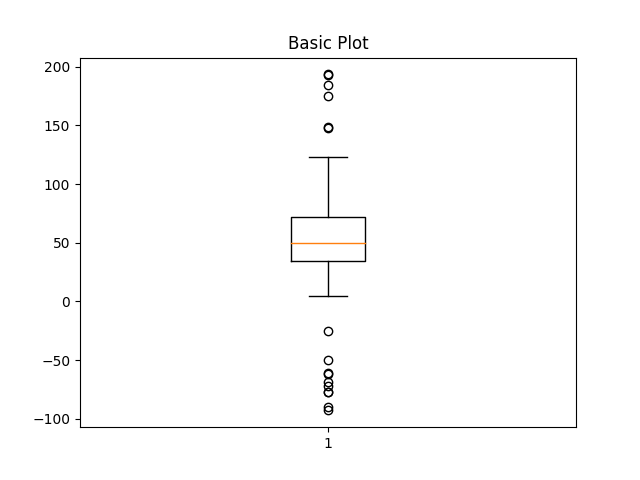
{'whiskers': [<matplotlib.lines.Line2D object at 0x7f2cfa981690>, <matplotlib.lines.Line2D object at 0x7f2d00e97cd0>], 'caps': [<matplotlib.lines.Line2D object at 0x7f2d00e94490>, <matplotlib.lines.Line2D object at 0x7f2cf9ed3b50>], 'boxes': [<matplotlib.lines.Line2D object at 0x7f2cfa982380>], 'medians': [<matplotlib.lines.Line2D object at 0x7f2d01443d00>], 'fliers': [<matplotlib.lines.Line2D object at 0x7f2d01443d90>], 'means': []}
fig2, ax2 = plt.subplots()
ax2.set_title('Notched boxes')
ax2.boxplot(data, notch=True)
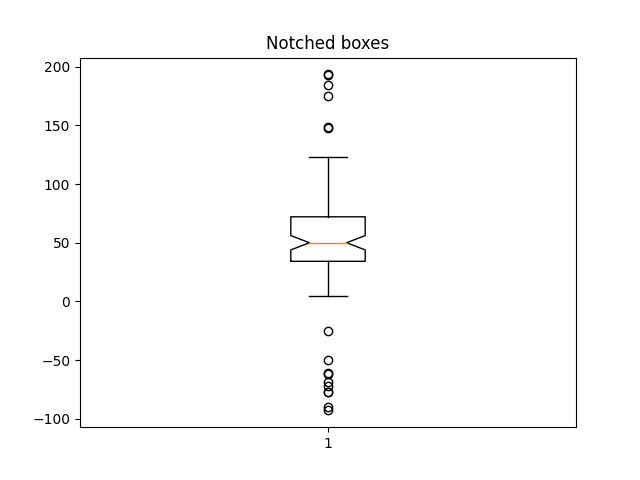
{'whiskers': [<matplotlib.lines.Line2D object at 0x7f2cfa921b10>, <matplotlib.lines.Line2D object at 0x7f2cfa920b50>], 'caps': [<matplotlib.lines.Line2D object at 0x7f2cfa920550>, <matplotlib.lines.Line2D object at 0x7f2cfa922590>], 'boxes': [<matplotlib.lines.Line2D object at 0x7f2cfa923760>], 'medians': [<matplotlib.lines.Line2D object at 0x7f2cfa922bc0>], 'fliers': [<matplotlib.lines.Line2D object at 0x7f2cfa920160>], 'means': []}
green_diamond = dict(markerfacecolor='g', marker='D')
fig3, ax3 = plt.subplots()
ax3.set_title('Changed Outlier Symbols')
ax3.boxplot(data, flierprops=green_diamond)
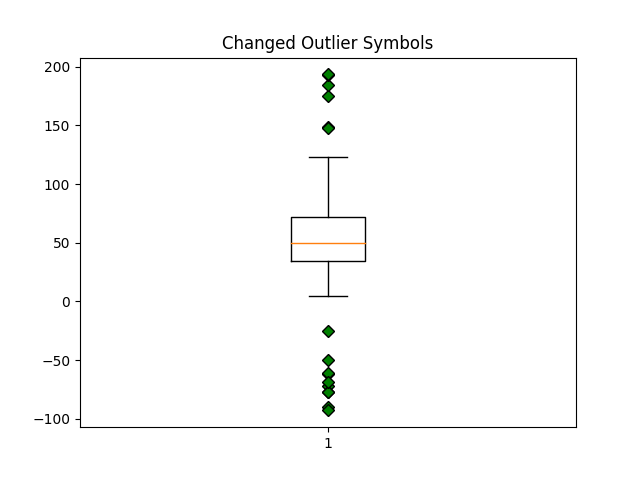
{'whiskers': [<matplotlib.lines.Line2D object at 0x7f2cfae88790>, <matplotlib.lines.Line2D object at 0x7f2cfb2d7f70>], 'caps': [<matplotlib.lines.Line2D object at 0x7f2cfb2d6a70>, <matplotlib.lines.Line2D object at 0x7f2cfb2d4700>], 'boxes': [<matplotlib.lines.Line2D object at 0x7f2cfae8bd90>], 'medians': [<matplotlib.lines.Line2D object at 0x7f2cfb2d61d0>], 'fliers': [<matplotlib.lines.Line2D object at 0x7f2cfb2d7b20>], 'means': []}
fig4, ax4 = plt.subplots()
ax4.set_title('Hide Outlier Points')
ax4.boxplot(data, showfliers=False)
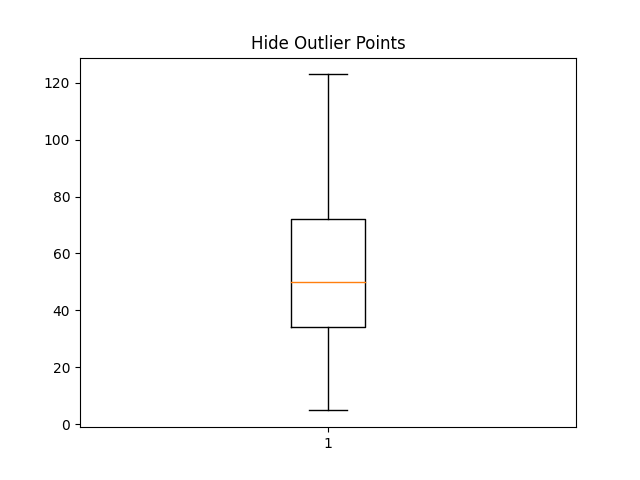
{'whiskers': [<matplotlib.lines.Line2D object at 0x7f2cfaa35ba0>, <matplotlib.lines.Line2D object at 0x7f2cfaa37520>], 'caps': [<matplotlib.lines.Line2D object at 0x7f2cfaa35cc0>, <matplotlib.lines.Line2D object at 0x7f2cfaa378e0>], 'boxes': [<matplotlib.lines.Line2D object at 0x7f2cfaa37af0>], 'medians': [<matplotlib.lines.Line2D object at 0x7f2cfaa36f20>], 'fliers': [], 'means': []}
red_square = dict(markerfacecolor='r', marker='s')
fig5, ax5 = plt.subplots()
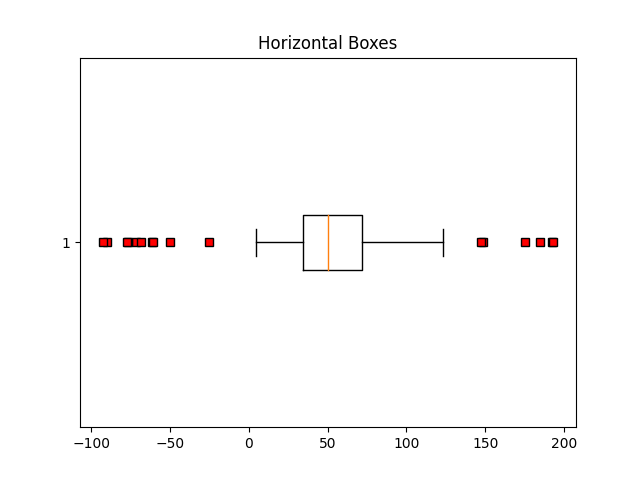
ax5.set_title('Horizontal Boxes')
ax5.boxplot(data, vert=False, flierprops=red_square)
{'whiskers': [<matplotlib.lines.Line2D object at 0x7f2d0106f790>, <matplotlib.lines.Line2D object at 0x7f2d0106ee30>], 'caps': [<matplotlib.lines.Line2D object at 0x7f2d0106ee60>, <matplotlib.lines.Line2D object at 0x7f2d0106edd0>], 'boxes': [<matplotlib.lines.Line2D object at 0x7f2d0106ff70>], 'medians': [<matplotlib.lines.Line2D object at 0x7f2d0106c670>], 'fliers': [<matplotlib.lines.Line2D object at 0x7f2d0106d120>], 'means': []}
fig6, ax6 = plt.subplots()
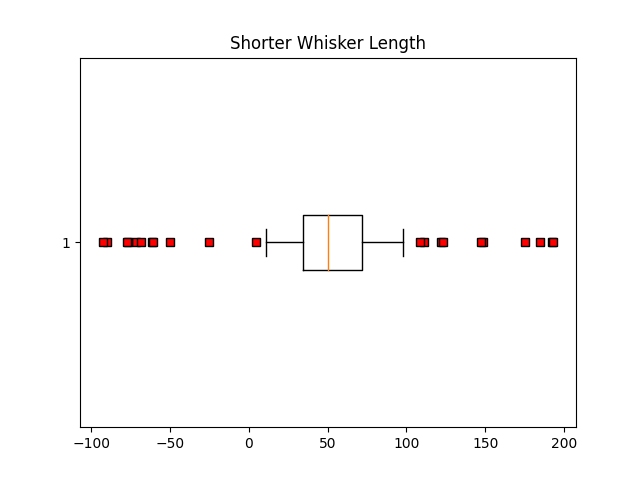
ax6.set_title('Shorter Whisker Length')
ax6.boxplot(data, flierprops=red_square, vert=False, whis=0.75)
{'whiskers': [<matplotlib.lines.Line2D object at 0x7f2d00d30100>, <matplotlib.lines.Line2D object at 0x7f2d00d32320>], 'caps': [<matplotlib.lines.Line2D object at 0x7f2d00d33790>, <matplotlib.lines.Line2D object at 0x7f2d00d324d0>], 'boxes': [<matplotlib.lines.Line2D object at 0x7f2d00d32530>], 'medians': [<matplotlib.lines.Line2D object at 0x7f2d00d30e80>], 'fliers': [<matplotlib.lines.Line2D object at 0x7f2d00d33490>], 'means': []}
Falsificar mais alguns dados
spread = np.random.rand(50) * 100
center = np.ones(25) * 40
flier_high = np.random.rand(10) * 100 + 100
flier_low = np.random.rand(10) * -100
d2 = np.concatenate((spread, center, flier_high, flier_low))
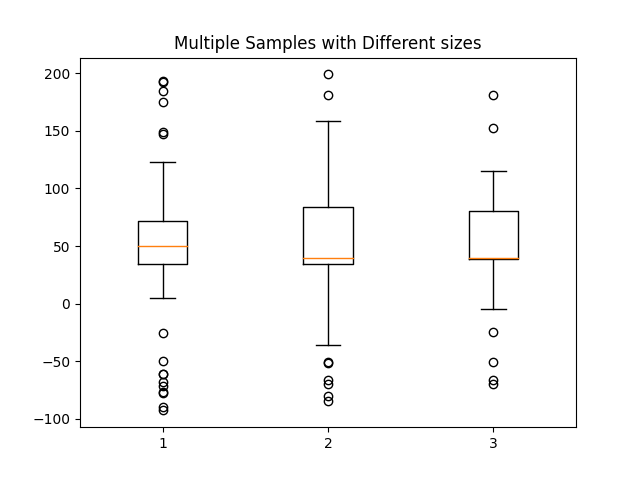
Fazer uma matriz 2-D só funciona se todas as colunas tiverem o mesmo comprimento. Se não estiverem, use uma lista. Isso é realmente mais eficiente porque o boxplot converte uma matriz 2-D em uma lista de vetores internamente de qualquer maneira.
data = [data, d2, d2[::2]]
fig7, ax7 = plt.subplots()
ax7.set_title('Multiple Samples with Different sizes')
ax7.boxplot(data)

plt.show()
Referências
O uso das seguintes funções, métodos, classes e módulos é mostrado neste exemplo:
Tempo total de execução do script: ( 0 minutos 1,863 segundos)