Observação
Clique aqui para baixar o código de exemplo completo
TickedStroke patheffect #
O Matplotlib patheffectspode ser usado para alterar a maneira como os caminhos são desenhados em um nível baixo o suficiente para afetar quase tudo.
O guia de patheffects detalha o uso de patheffects.
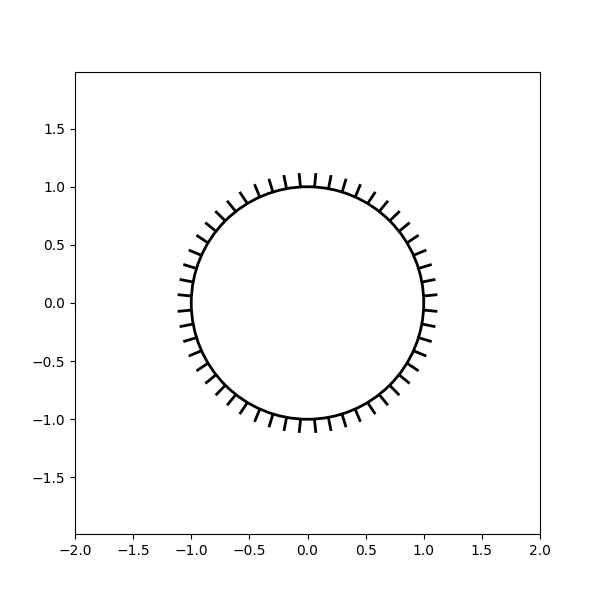
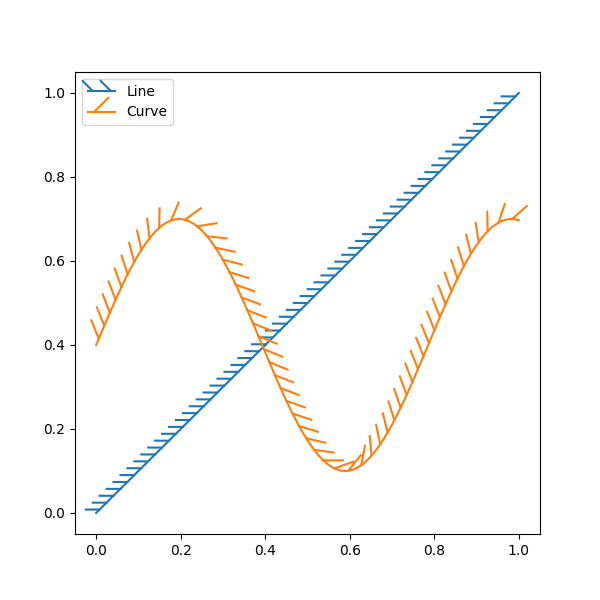
O TickedStrokepatheffect ilustrado aqui desenha um caminho com um estilo marcado. O espaçamento, comprimento e ângulo dos carrapatos podem ser controlados.
Veja também o exemplo de demonstração do contorno .
Veja também os contornos no exemplo de otimização .
Aplicando TickedStroke a caminhos #
import matplotlib.patches as patches
from matplotlib.path import Path
import numpy as np
import matplotlib.pyplot as plt
import matplotlib.patheffects as patheffects

fig, ax = plt.subplots(figsize=(6, 6))
path = Path.unit_circle()
patch = patches.PathPatch(path, facecolor='none', lw=2, path_effects=[
    patheffects.withTickedStroke(angle=-90, spacing=10, length=1)])

ax.add_patch(patch)
ax.axis('equal')
ax.set_xlim(-2, 2)
ax.set_ylim(-2, 2)

plt.show()

Aplicando TickedStroke às linhas #
fig, ax = plt.subplots(figsize=(6, 6))
ax.plot([0, 1], [0, 1], label="Line",
        path_effects=[patheffects.withTickedStroke(spacing=7, angle=135)])

nx = 101
x = np.linspace(0.0, 1.0, nx)
y = 0.3*np.sin(x*8) + 0.4
ax.plot(x, y, label="Curve", path_effects=[patheffects.withTickedStroke()])

ax.legend()

plt.show()

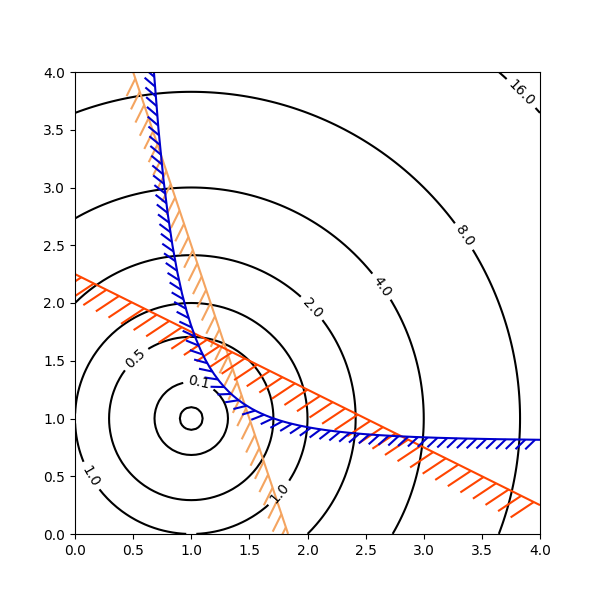
Aplicando TickedStroke a plotagens de contorno #
Plotagem de contorno com objetivo e restrições. As curvas geradas pelo contorno para representar uma restrição típica em um problema de otimização devem ser plotadas com ângulos entre zero e 180 graus.
fig, ax = plt.subplots(figsize=(6, 6))

nx = 101
ny = 105

# Set up survey vectors
xvec = np.linspace(0.001, 4.0, nx)
yvec = np.linspace(0.001, 4.0, ny)

# Set up survey matrices.  Design disk loading and gear ratio.
x1, x2 = np.meshgrid(xvec, yvec)

# Evaluate some stuff to plot
obj = x1**2 + x2**2 - 2*x1 - 2*x2 + 2
g1 = -(3*x1 + x2 - 5.5)
g2 = -(x1 + 2*x2 - 4.5)
g3 = 0.8 + x1**-3 - x2

cntr = ax.contour(x1, x2, obj, [0.01, 0.1, 0.5, 1, 2, 4, 8, 16],
                  colors='black')
ax.clabel(cntr, fmt="%2.1f", use_clabeltext=True)

cg1 = ax.contour(x1, x2, g1, [0], colors='sandybrown')
plt.setp(cg1.collections,
         path_effects=[patheffects.withTickedStroke(angle=135)])

cg2 = ax.contour(x1, x2, g2, [0], colors='orangered')
plt.setp(cg2.collections,
         path_effects=[patheffects.withTickedStroke(angle=60, length=2)])

cg3 = ax.contour(x1, x2, g3, [0], colors='mediumblue')
plt.setp(cg3.collections,
         path_effects=[patheffects.withTickedStroke(spacing=7)])

ax.set_xlim(0, 4)
ax.set_ylim(0, 4)

plt.show()

Tempo total de execução do script: ( 0 minutos 1,492 segundos)