Observação
Clique aqui para baixar o código de exemplo completo
Linha Coleção #
Traçando linhas com Matplotlib.
LineCollectionpermite traçar várias linhas em uma figura. Abaixo mostramos algumas de suas propriedades.
import matplotlib.pyplot as plt
from matplotlib.collections import LineCollection
from matplotlib import colors as mcolors
import numpy as np
# In order to efficiently plot many lines in a single set of axes,
# Matplotlib has the ability to add the lines all at once. Here is a
# simple example showing how it is done.
x = np.arange(100)
# Here are many sets of y to plot vs. x
ys = x[:50, np.newaxis] + x[np.newaxis, :]
segs = np.zeros((50, 100, 2))
segs[:, :, 1] = ys
segs[:, :, 0] = x
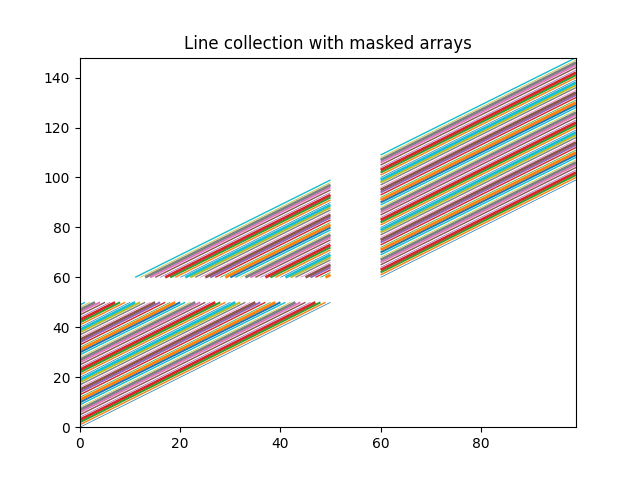
# Mask some values to test masked array support:
segs = np.ma.masked_where((segs > 50) & (segs < 60), segs)
# We need to set the plot limits.
fig, ax = plt.subplots()
ax.set_xlim(x.min(), x.max())
ax.set_ylim(ys.min(), ys.max())
# *colors* is sequence of rgba tuples.
# *linestyle* is a string or dash tuple. Legal string values are
# solid|dashed|dashdot|dotted. The dash tuple is (offset, onoffseq) where
# onoffseq is an even length tuple of on and off ink in points. If linestyle
# is omitted, 'solid' is used.
# See `matplotlib.collections.LineCollection` for more information.
colors = [mcolors.to_rgba(c)
for c in plt.rcParams['axes.prop_cycle'].by_key()['color']]
line_segments = LineCollection(segs, linewidths=(0.5, 1, 1.5, 2),
colors=colors, linestyle='solid')
ax.add_collection(line_segments)
ax.set_title('Line collection with masked arrays')
plt.show()
Para plotar com eficiência muitas linhas em um único conjunto de eixos, o Matplotlib tem a capacidade de adicionar as linhas de uma só vez. Aqui está um exemplo simples mostrando como isso é feito.
N = 50
x = np.arange(N)
# Here are many sets of y to plot vs. x
ys = [x + i for i in x]
# We need to set the plot limits, they will not autoscale
fig, ax = plt.subplots()
ax.set_xlim(np.min(x), np.max(x))
ax.set_ylim(np.min(ys), np.max(ys))
# colors is sequence of rgba tuples
# linestyle is a string or dash tuple. Legal string values are
# solid|dashed|dashdot|dotted. The dash tuple is (offset, onoffseq)
# where onoffseq is an even length tuple of on and off ink in points.
# If linestyle is omitted, 'solid' is used
# See `matplotlib.collections.LineCollection` for more information
# Make a sequence of (x, y) pairs.
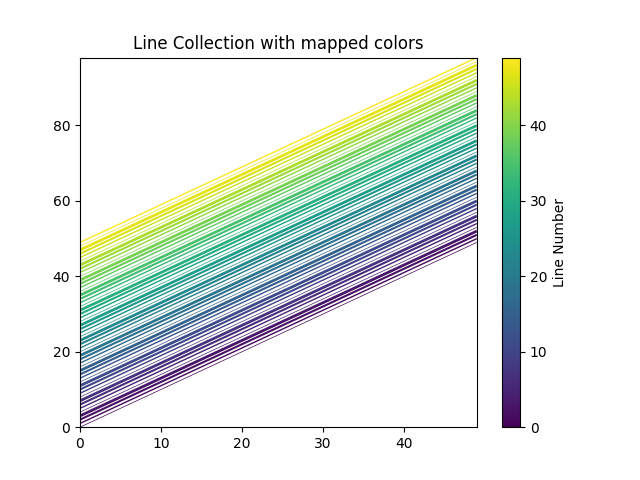
line_segments = LineCollection([np.column_stack([x, y]) for y in ys],
linewidths=(0.5, 1, 1.5, 2),
linestyles='solid')
line_segments.set_array(x)
ax.add_collection(line_segments)
axcb = fig.colorbar(line_segments)
axcb.set_label('Line Number')
ax.set_title('Line Collection with mapped colors')
plt.sci(line_segments) # This allows interactive changing of the colormap.
plt.show()
Referências
O uso das seguintes funções, métodos, classes e módulos é mostrado neste exemplo:
Tempo total de execução do script: ( 0 minutos 1,012 segundos)