Observação
Clique aqui para baixar o código de exemplo completo
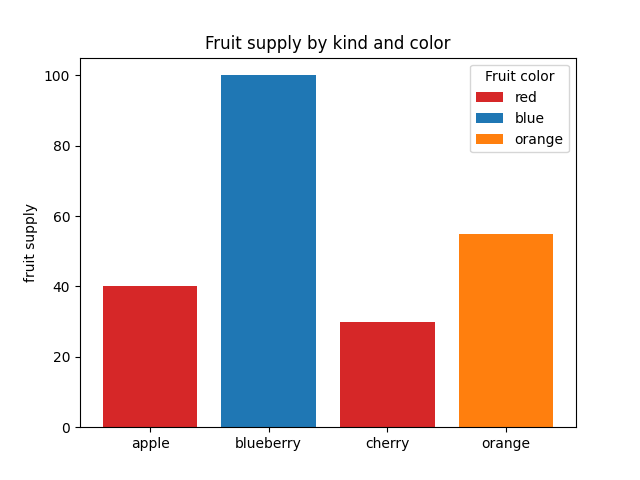
Demonstração da cor da barra #
Este é um exemplo que mostra como controlar a cor da barra e as entradas de legenda usando os parâmetros de cor e rótulobar de . Observe que os rótulos com um sublinhado anterior não aparecerão na legenda.
import matplotlib.pyplot as plt

fig, ax = plt.subplots()

fruits = ['apple', 'blueberry', 'cherry', 'orange']
counts = [40, 100, 30, 55]
bar_labels = ['red', 'blue', '_red', 'orange']
bar_colors = ['tab:red', 'tab:blue', 'tab:red', 'tab:orange']

ax.bar(fruits, counts, label=bar_labels, color=bar_colors)

ax.set_ylabel('fruit supply')
ax.set_title('Fruit supply by kind and color')
ax.legend(title='Fruit color')

plt.show()