Observação
Clique aqui para baixar o código de exemplo completo
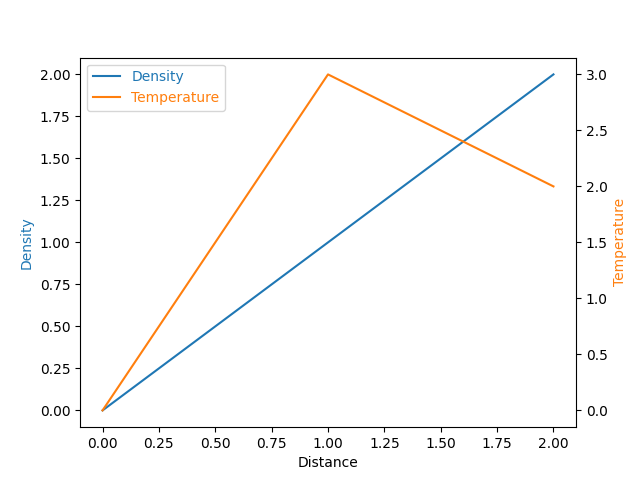
Parasita Simples #

import matplotlib.pyplot as plt
from mpl_toolkits.axes_grid1 import host_subplot

host = host_subplot(111)
par = host.twinx()

host.set_xlabel("Distance")
host.set_ylabel("Density")
par.set_ylabel("Temperature")

p1, = host.plot([0, 1, 2], [0, 1, 2], label="Density")
p2, = par.plot([0, 1, 2], [0, 3, 2], label="Temperature")

host.legend(labelcolor="linecolor")

host.yaxis.get_label().set_color(p1.get_color())
par.yaxis.get_label().set_color(p2.get_color())

plt.show()