Observação
Clique aqui para baixar o código de exemplo completo
Projeções Geográficas #
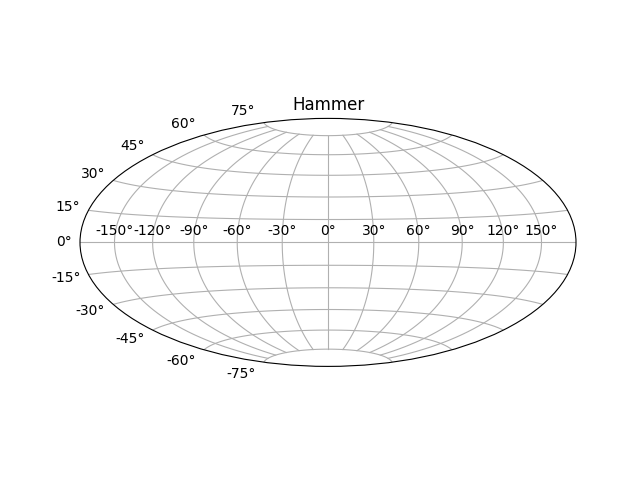
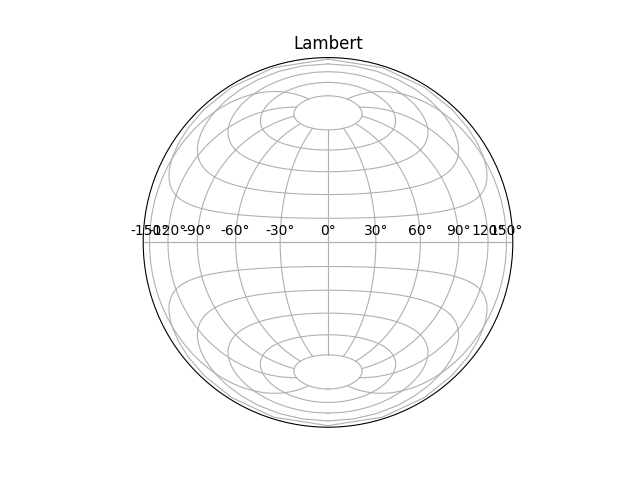
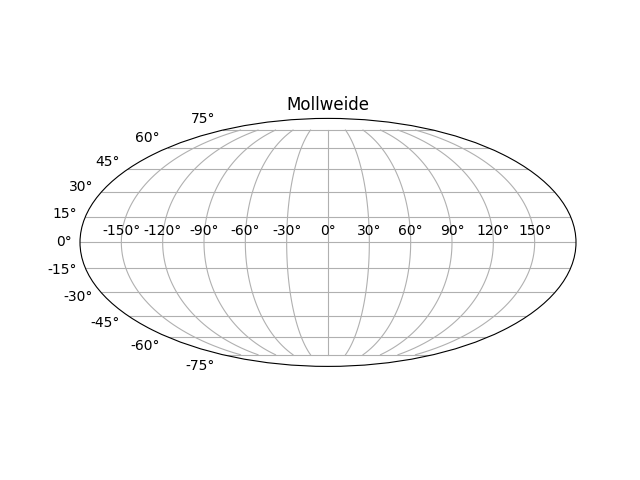
Isso mostra 4 projeções geográficas possíveis. Cartopy suporta mais projeções.
import matplotlib.pyplot as plt
plt.figure()
plt.subplot(projection="aitoff")
plt.title("Aitoff")
plt.grid(True)

plt.figure()
plt.subplot(projection="hammer")
plt.title("Hammer")
plt.grid(True)
plt.figure()
plt.subplot(projection="lambert")
plt.title("Lambert")
plt.grid(True)
plt.figure()
plt.subplot(projection="mollweide")
plt.title("Mollweide")
plt.grid(True)

plt.show()
Tempo total de execução do script: ( 0 minutos 1,707 segundos)