Observação
Clique aqui para baixar o código de exemplo completo
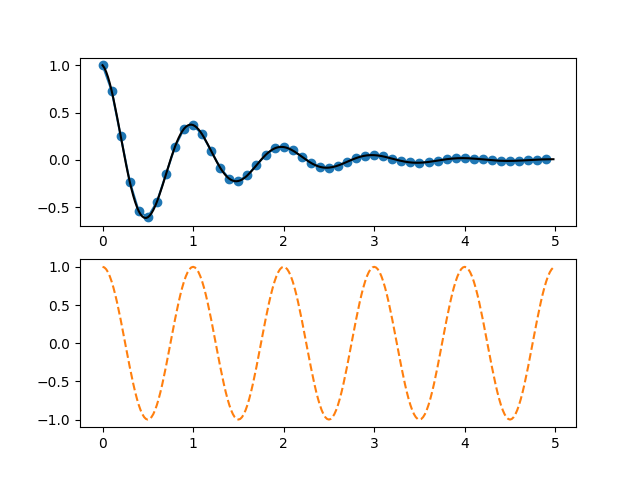
Pyplot Dois Subplots #
Crie uma figura com dois subplots com pyplot.subplot.
import numpy as np
import matplotlib.pyplot as plt


def f(t):
    return np.exp(-t) * np.cos(2*np.pi*t)


t1 = np.arange(0.0, 5.0, 0.1)
t2 = np.arange(0.0, 5.0, 0.02)

plt.figure()
plt.subplot(211)
plt.plot(t1, f(t1), color='tab:blue', marker='o')
plt.plot(t2, f(t2), color='black')

plt.subplot(212)
plt.plot(t2, np.cos(2*np.pi*t2), color='tab:orange', linestyle='--')
plt.show()
Referências
O uso das seguintes funções, métodos, classes e módulos é mostrado neste exemplo: