Observação
Clique aqui para baixar o código de exemplo completo
Gráfico de bolha cheia #
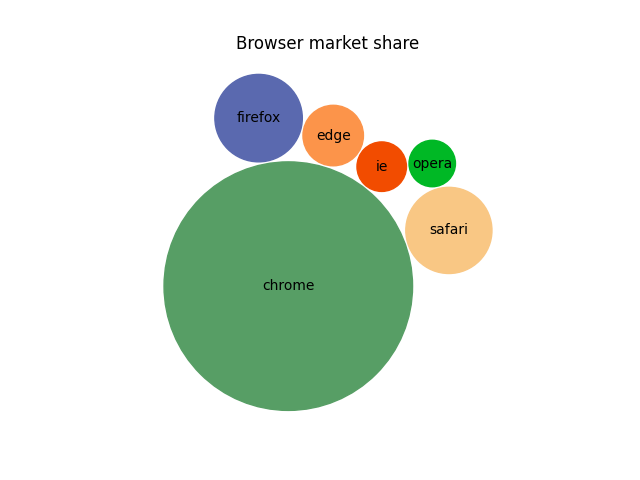
Crie um gráfico de bolhas compactadas para representar dados escalares. O algoritmo apresentado tenta mover todas as bolhas o mais próximo possível do centro de massa, evitando algumas colisões movendo-se em torno de objetos em colisão. Neste exemplo, plotamos a participação de mercado de diferentes navegadores de desktop. (fonte: https://gs.statcounter.com/browser-market-share/desktop/worldwidev )

import numpy as np
import matplotlib.pyplot as plt

browser_market_share = {
    'browsers': ['firefox', 'chrome', 'safari', 'edge', 'ie', 'opera'],
    'market_share': [8.61, 69.55, 8.36, 4.12, 2.76, 2.43],
    'color': ['#5A69AF', '#579E65', '#F9C784', '#FC944A', '#F24C00', '#00B825']
}


class BubbleChart:
    def __init__(self, area, bubble_spacing=0):
        """
        Setup for bubble collapse.

        Parameters
        ----------
        area : array-like
            Area of the bubbles.
        bubble_spacing : float, default: 0
            Minimal spacing between bubbles after collapsing.

        Notes
        -----
        If "area" is sorted, the results might look weird.
        """
        area = np.asarray(area)
        r = np.sqrt(area / np.pi)

        self.bubble_spacing = bubble_spacing
        self.bubbles = np.ones((len(area), 4))
        self.bubbles[:, 2] = r
        self.bubbles[:, 3] = area
        self.maxstep = 2 * self.bubbles[:, 2].max() + self.bubble_spacing
        self.step_dist = self.maxstep / 2

        # calculate initial grid layout for bubbles
        length = np.ceil(np.sqrt(len(self.bubbles)))
        grid = np.arange(length) * self.maxstep
        gx, gy = np.meshgrid(grid, grid)
        self.bubbles[:, 0] = gx.flatten()[:len(self.bubbles)]
        self.bubbles[:, 1] = gy.flatten()[:len(self.bubbles)]

        self.com = self.center_of_mass()

    def center_of_mass(self):
        return np.average(
            self.bubbles[:, :2], axis=0, weights=self.bubbles[:, 3]
        )

    def center_distance(self, bubble, bubbles):
        return np.hypot(bubble[0] - bubbles[:, 0],
                        bubble[1] - bubbles[:, 1])

    def outline_distance(self, bubble, bubbles):
        center_distance = self.center_distance(bubble, bubbles)
        return center_distance - bubble[2] - \
            bubbles[:, 2] - self.bubble_spacing

    def check_collisions(self, bubble, bubbles):
        distance = self.outline_distance(bubble, bubbles)
        return len(distance[distance < 0])

    def collides_with(self, bubble, bubbles):
        distance = self.outline_distance(bubble, bubbles)
        idx_min = np.argmin(distance)
        return idx_min if type(idx_min) == np.ndarray else [idx_min]

    def collapse(self, n_iterations=50):
        """
        Move bubbles to the center of mass.

        Parameters
        ----------
        n_iterations : int, default: 50
            Number of moves to perform.
        """
        for _i in range(n_iterations):
            moves = 0
            for i in range(len(self.bubbles)):
                rest_bub = np.delete(self.bubbles, i, 0)
                # try to move directly towards the center of mass
                # direction vector from bubble to the center of mass
                dir_vec = self.com - self.bubbles[i, :2]

                # shorten direction vector to have length of 1
                dir_vec = dir_vec / np.sqrt(dir_vec.dot(dir_vec))

                # calculate new bubble position
                new_point = self.bubbles[i, :2] + dir_vec * self.step_dist
                new_bubble = np.append(new_point, self.bubbles[i, 2:4])

                # check whether new bubble collides with other bubbles
                if not self.check_collisions(new_bubble, rest_bub):
                    self.bubbles[i, :] = new_bubble
                    self.com = self.center_of_mass()
                    moves += 1
                else:
                    # try to move around a bubble that you collide with
                    # find colliding bubble
                    for colliding in self.collides_with(new_bubble, rest_bub):
                        # calculate direction vector
                        dir_vec = rest_bub[colliding, :2] - self.bubbles[i, :2]
                        dir_vec = dir_vec / np.sqrt(dir_vec.dot(dir_vec))
                        # calculate orthogonal vector
                        orth = np.array([dir_vec[1], -dir_vec[0]])
                        # test which direction to go
                        new_point1 = (self.bubbles[i, :2] + orth *
                                      self.step_dist)
                        new_point2 = (self.bubbles[i, :2] - orth *
                                      self.step_dist)
                        dist1 = self.center_distance(
                            self.com, np.array([new_point1]))
                        dist2 = self.center_distance(
                            self.com, np.array([new_point2]))
                        new_point = new_point1 if dist1 < dist2 else new_point2
                        new_bubble = np.append(new_point, self.bubbles[i, 2:4])
                        if not self.check_collisions(new_bubble, rest_bub):
                            self.bubbles[i, :] = new_bubble
                            self.com = self.center_of_mass()

            if moves / len(self.bubbles) < 0.1:
                self.step_dist = self.step_dist / 2

    def plot(self, ax, labels, colors):
        """
        Draw the bubble plot.

        Parameters
        ----------
        ax : matplotlib.axes.Axes
        labels : list
            Labels of the bubbles.
        colors : list
            Colors of the bubbles.
        """
        for i in range(len(self.bubbles)):
            circ = plt.Circle(
                self.bubbles[i, :2], self.bubbles[i, 2], color=colors[i])
            ax.add_patch(circ)
            ax.text(*self.bubbles[i, :2], labels[i],
                    horizontalalignment='center', verticalalignment='center')


bubble_chart = BubbleChart(area=browser_market_share['market_share'],
                           bubble_spacing=0.1)

bubble_chart.collapse()

fig, ax = plt.subplots(subplot_kw=dict(aspect="equal"))
bubble_chart.plot(
    ax, browser_market_share['browsers'], browser_market_share['color'])
ax.axis("off")
ax.relim()
ax.autoscale_view()
ax.set_title('Browser market share')

plt.show()