Observação
Clique aqui para baixar o código de exemplo completo
Preencher Entrex Demonstração #
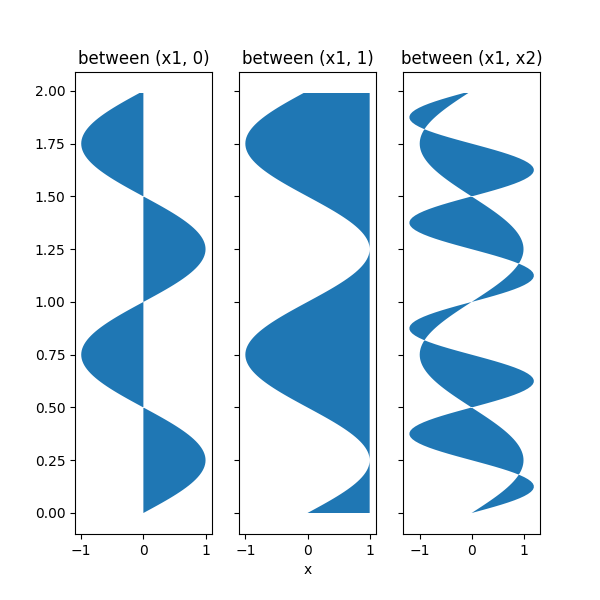
Usando fill_betweenxpara colorir ao longo da direção horizontal entre duas curvas.
import matplotlib.pyplot as plt
import numpy as np


y = np.arange(0.0, 2, 0.01)
x1 = np.sin(2 * np.pi * y)
x2 = 1.2 * np.sin(4 * np.pi * y)

fig, [ax1, ax2, ax3] = plt.subplots(1, 3, sharey=True, figsize=(6, 6))

ax1.fill_betweenx(y, 0, x1)
ax1.set_title('between (x1, 0)')

ax2.fill_betweenx(y, x1, 1)
ax2.set_title('between (x1, 1)')
ax2.set_xlabel('x')

ax3.fill_betweenx(y, x1, x2)
ax3.set_title('between (x1, x2)')

Text(0.5, 1.0, 'between (x1, x2)')
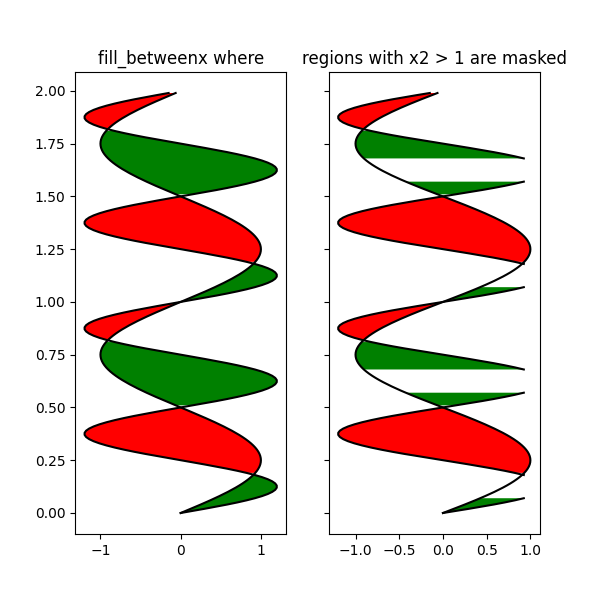
Agora preencha entre x1 e x2 onde uma condição lógica é atendida. Observe que isso é diferente de chamar:
por causa dos efeitos de borda em várias regiões contíguas.
fig, [ax, ax1] = plt.subplots(1, 2, sharey=True, figsize=(6, 6))
ax.plot(x1, y, x2, y, color='black')
ax.fill_betweenx(y, x1, x2, where=x2 >= x1, facecolor='green')
ax.fill_betweenx(y, x1, x2, where=x2 <= x1, facecolor='red')
ax.set_title('fill_betweenx where')

# Test support for masked arrays.
x2 = np.ma.masked_greater(x2, 1.0)
ax1.plot(x1, y, x2, y, color='black')
ax1.fill_betweenx(y, x1, x2, where=x2 >= x1, facecolor='green')
ax1.fill_betweenx(y, x1, x2, where=x2 <= x1, facecolor='red')
ax1.set_title('regions with x2 > 1 are masked')

Text(0.5, 1.0, 'regions with x2 > 1 are masked')
Este exemplo ilustra um problema; por causa da grade de dados, existem triângulos não preenchidos indesejados nos pontos de cruzamento. Uma solução de força bruta seria interpolar todas as matrizes em uma grade muito fina antes de plotar.
plt.show()
Tempo total de execução do script: ( 0 minutos 1,113 segundos)