Observação
Clique aqui para baixar o código de exemplo completo
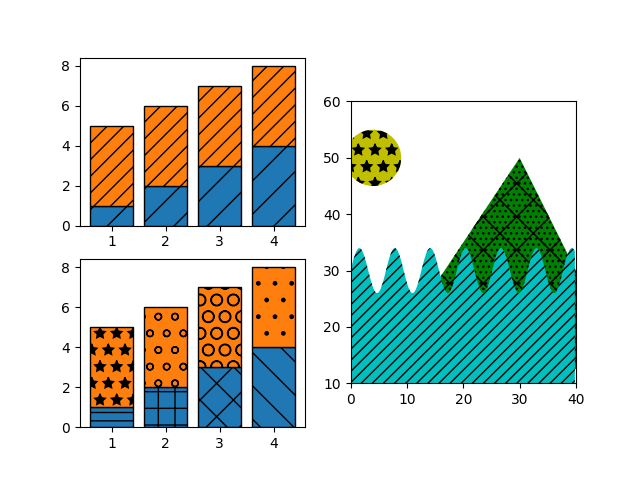
Demonstração da escotilha #
As hachuras podem ser adicionadas à maioria dos polígonos no Matplotlib, incluindo bar,
fill_between, contourfe filhos de Polygon. Atualmente, eles são suportados nos back-ends PS, PDF, SVG, OSX e Agg. Os back-ends WX e Cairo atualmente não suportam hachura.
Consulte também Hachuras de contorno para obter um exemplo usando contourf, e
Referência de estilo de hachura para obter amostras das hachuras existentes.
import numpy as np
import matplotlib.pyplot as plt
from matplotlib.patches import Ellipse, Polygon

x = np.arange(1, 5)
y1 = np.arange(1, 5)
y2 = np.ones(y1.shape) * 4

fig = plt.figure()
axs = fig.subplot_mosaic([['bar1', 'patches'], ['bar2', 'patches']])

axs['bar1'].bar(x, y1, edgecolor='black', hatch="/")
axs['bar1'].bar(x, y2, bottom=y1, edgecolor='black', hatch='//')

axs['bar2'].bar(x, y1, edgecolor='black', hatch=['--', '+', 'x', '\\'])
axs['bar2'].bar(x, y2, bottom=y1, edgecolor='black',
                hatch=['*', 'o', 'O', '.'])

x = np.arange(0, 40, 0.2)
axs['patches'].fill_between(x, np.sin(x) * 4 + 30, y2=0,
                            hatch='///', zorder=2, fc='c')
axs['patches'].add_patch(Ellipse((4, 50), 10, 10, fill=True,
                                 hatch='*', facecolor='y'))
axs['patches'].add_patch(Polygon([(10, 20), (30, 50), (50, 10)],
                                 hatch='\\/...', facecolor='g'))
axs['patches'].set_xlim([0, 40])
axs['patches'].set_ylim([10, 60])
axs['patches'].set_aspect(1)
plt.show()

Referências
O uso das seguintes funções, métodos, classes e módulos é mostrado neste exemplo: